
What Is the Use of Global Temperature If It Really Doesn't Exist? |
By T.L. Winslow (TLW), the Historyscoper™ |
© Copyright by T.L. Winslow. All Rights Reserved. |
Original Pub. Date: Jan. 30, 2020. Last Update: July 12, 2026. |
"Trillions of dollars are being spent ostensibly to avert a threatened global climate disaster. According to the UN Intergovernmental Panel on Climate Change (IPCC), the global mean surface temperature (GMST) must not increase more than a stated amount above the pre-industrial baseline (1850–1900) to prevent irreversible catastrophe. However, the GMST does not have a precise regulatory definition, and is in fact physically meaningless based on fundamental principles of thermodynamics. Nevertheless, a ll IPCC climate models are tuned to reproduce historical GMST trends. This represents what Orwell presciently described: the systematic replacement of objective truth with politically convenient fictiion." - The Father of Lies Hijacking Climate Science: Global Mean Surface Temperature Does Not Exist"
“THE TRICKY THING about climate change, and explaining what it is, is that it's very hard to see. It's hard to feel the rising temperatures when the difference is one- or t wo-tenths of a degree a year. But those tenths of degrees add up.” - Nikolaj Coster-Waldau, Game of Thrones Star Sounds the Alarm on Climate Change, Nov. 6, 2017
"The supposed measuring of global average temperatures from 1890 has been based on thermometer readouts barely covering 5 per cent of the globe until the satellite era began 40-50 years ago. We do not know how global climate has changed in the past century, all we know is some limited regional climate changes, such as in Europe, North America and parts of Asia." - Can We 'Trust the Science'?
Discussions on global warming often refer to 'global temperature.' Yet the concept is thermodynamically as well as mathematically an impossibility, says Bjarne Andresen, a professor at The Niels Bohr Institute, University of Copenhagen, who has analyzed this topic in collaboration with professors Christopher Essex from University of Western Ontario and Ross McKitrick from University of Guelph, Canada.It is generally assumed that the atmosphere and the oceans have grown warmer during the recent 50 years. The reason for this point of view is an upward trend in the curve of measurements of the so-called 'global temperature'. This is the temperature obtained by collecting measurements of air temperatures at a large number of measuring stations around the Globe, weighing them according to the area they represent, and then calculating the yearly average according to the usual method of adding all values and dividing by the number of points.
Average without meaning
"It is impossible to talk about a single temperature for something as complicated as the climate of Earth", Bjarne Andresen says, an expert of thermodynamics. "A temperature can be defined only for a homogeneous system. Furthermore, the climate is not governed by a single temperature. Rather, differences of temperatures drive the processes and create the storms, sea currents, thunder, etc. which make up the climate.
"He explains that while it is possible to treat temperature statistically locally, it is meaningless to talk about a global temperature for Earth. The Globe consists of a huge number of components which one cannot just add up and average. That would correspond to calculating the average phone number in the phone book. That is meaningless. Or talking about economics, it does make sense to compare the currency exchange rate of two countries, whereas there is no point in talking about an average 'global exchange rate'". -
- Researchers Question Validity Of A 'Global Temperature'
The average global temperature of the Earth is a statistical parameter that has no real physical meaning. The effective temperature of the Earth is an imaginary value calculated assuming that the Earth is a black body, described by the Stefan-Boltzmann equation. The value of the radiated energy included in this equation is determined using incorrect and questionable assumptions. It is concluded that the comparison of the average global and effective temperatures of the Earth does not make sense.
"The Earth has a fever (video)
Debunking the totally fake GAT numbers from NOAA and WMO
The UK Met Office has again been caught publishing temperatures from weather stations that don't exist.
-Electroverse
An FOI revealed Lowestoft closed in 2010, yet the Met Office kept issuing official temperatures for it.
The office said they were using well-correlated neighboring stations, but the FOI revealed that this was a lie. The numbers were actually coming from a model that was inventing data from 'phantom' neighboring stations.
When exposed, the office quietly deleted years of readings for Lowestoft, as well as a number of other stations, and added a disclaimer saying their data is "for general interest only."
FOIs also show over one third of Met Office stations never existed, and that real high-quality sites like Colwood are ignored.
Also, more than 80% of the network is low-grade class 4 or 5, by WMO standards, giving 2-5C uncertainty.
This is the foundation of the UK's climate record – closed stations, imaginary stations and synthetic temperatures.
Everything in modern climate policy rests on a single number: global average temperature.
Trillions of dollars. Energy policy. Food prices. National security. Personal freedom.
And yet that number is not directly measured.
It is constructed.
Dr. Matthew M. Wielicki
"People need to understand that for the 20th century as a whole there’s temperature data for less than 50 percent of the Earth’s surface. And a lot of stuff is just being filled in with with assumptions or modeling work, so it’s really the output of models." - McKitrick: Reckoning Coming for Climate Alarmists

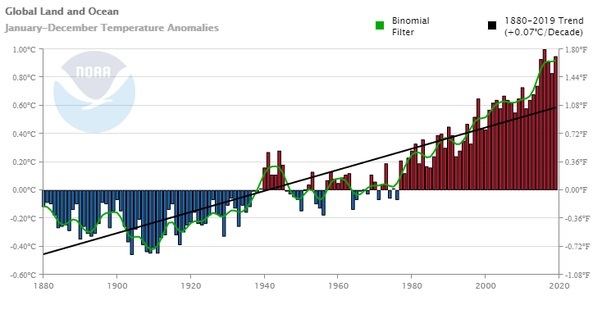
Not global temperature, global yearly avg. surface temperature (GAT), global mean surface temperature (GMST). \You can’t stick a big thermometer up the Earth’s butt like a baby, sorry, and while it might have a single central temperature, the Earth can’t have one single surface temperature because it is spinning under the Sun and heating and cooling at the same time while there is no thermal conductivity through Earth's center, hence there is no way that Earth’s surface temperatures can instantly equalize. Therefore it can't have an average surface temperature. This artificial computer-generated quantity the IPCC calls GAT based on a ton of temperature measurement stations with questionable data of uncertain accuracy was created solely for use by the environmental leftists and globalist Marxists centered in the U.N. and its IPCC global octopus of kept scientists, academics, journalists, and politicians to foist the hoax that CO2 is evil. CO2 isn’t even a molecule to them with more oxygen than carbon, it’s “carbon pollution”, and the only way to save the world they claim is to dismantle the fossil fuel industry and capitalism with it to pave the way for their real goal of global Marxism. It's a political not a scientific concept. In reality, all weather is local, and the IPCC's GAT isn't a physical quantity but a Marxist-style Five Year Plan propaganda tool that they can make read anything. Above is one of their superficially alarming graphs that actually only claims a total of 1.1C avg. temp rise since 1880, which is an average of 0.007C per year, or 0.07C per decade, which is indistinguishable from a big fat zero, and is unfalsifiable by independent researchers. - NASA: World of Change: Global Temperatures
In the Image of NOAA: How NOAA controls how we see temperature data (video)
*FLASH!* In 2021 NASA reduced 1.1C way down to 0.85C, throwing all the IPCC octopus' doomsday global runaway scenarios farther into the money-lined future. - NASA.gov: Global Temperature
Lord Walter Scott said, “What a tangled web we weave when first we practice to deceive.” Another great author expanded on that idea but from a different perspective. Mark Twain said, “If you tell the truth you don’t have to remember.” In a strange way, they contradict or at least explain how the deception spread, persisted, and achieved their damaging goal. The web becomes so tangled and the connection between tangles so complicated that people never see what is happening. This is particularly true if the deception is about an arcane topic unfamiliar to a majority of the people. All these observations apply to the biggest deception in history, the claim that human production of CO2 is causing global warming. The objective is unknown to most people even today, and that is a measure of the success. The real objective was to prove overpopulation combined with industrial development was exhausting resources at an unsustainable rate. As Maurice Strong explained the problem for the planet are the industrialized nations and isn’t it our responsibility to get rid of them. The hypothesis this generated was that CO2, the byproduct of burning fossil fuel, was causing global warming and destroying the Earth. They had to protect the charge against CO2 at all cost, and that is where the tangled web begins. At the start, the IPCC and agencies supporting them had control over the two important variables, the temperature, and the CO2. Phil Jones expressed the degree of control over temperature in response to Warwick Hughes’ request for which stations he used and how they were adjusted in his graph, He received the following reply on 21, February 2005. “We have 25 or so years invested in the work. Why should I make the data available to you, when your aim is to try and find something wrong with it.” Control over the global temperature data continued until the first satellite data appeared in 1978. Despite the limitations, it provided more complete coverage; the claim is 97 to 98%. This compares with the approximately 15% coverage of the surface data.
- Anthropogenic Global Warming (AGW); A Tangled Web Strangling Its Creators and Proponents
Faulty Data Exposed: Reported Temperatures Aren't True - Anthony Watts (vide0)
Like any octopus (actually cult) with many tentacles that all have the same bosses and funding source, the IPCC politicians are free to falsify their own scientists' reports in their "executive summaries", which get the widest distribution since they use them to sell their money-power grab. - Chinese Whispers & The IPCC
What is the difference between the WEF's 'Great Reset' proposal and Communism or socialism? by TLW
The concept of "average Earth temperature" is critical to their bogus forecasting, but because we think "average" generally means something useful, it gets a mental pass. As an example, describe the "average" human. Let me offer a thought experiment. What is the average temperature of your house within one degree? How many sensors, with what degree of accuracy reading the temperature, how often, would you need to know the average temperature within one degree? One sensor won't do it. Would ten sensors (a hundred? a thousand?) be needed to cover the ceilings, floors, six feet up, each corner of every room, near every door and window and heat source, measuring the temperature every hour, minute, second for a period of years, to get an average temperature within one degree? How do you weight a gage in a big room versus a small one, or in the ceiling versus the floor?
- The Blunt Truth About Global Warming
I think most scientists don’t even really know how a thermometer is manufactured or how a temperature measuring device is manufactured and they just believe also that if one exists it’s accurate.
I’ve seen supposed governing( governmental agency ) experts utilize measuring devices that gave a ridiculous reading that defied what other devices said and held to the belief that because it was “them” doing
the measuring it was extremely accurate. The evidence refuted their reading on multiple levels and they quickly scampered off as a nice government employee does so that he could avoid scrutiny and also avoid
touching his pension by any means.
All devices used for measurement must be calibrated and their factory calibration is only warranted for one year and within 2 days of purchase could be dropped and cause an error to show up, nobody wants to
admit they dropped something, right?
Also to gain an average temperature in a large room it would be conducive to measure at least at 8 locations because stratifications can occur and also airflow patterns greatly affect temperature. so how is it that
the easy path of utilizing temperatures from various governmental agency locations are used to produce data on earths temperature and then narrated as if some global heat strike or cold strike is coming without
\a full discernment of what is called science.
The accuracy range of most measuring devices is based on a standard, someone can purchase 3 or 4 of the exact device and there will be a deviation of readings typically and some of this is rooted in calibration errors
and electronic issues with the device. When these global cult leaders are complaining about a .6 deg rise over a few years you know that the white coat needs to come off them and exchanged for either a straight jacket
or a place with vertical bars, it all depends on the findings at the legal trial with jury.
IPCC agitprop artists love to scare people with announcements of increasing average temperature trends in various locales, while ignoring the truth that real climate science uses temperature anomalies that cover more area.
- Facebook Spamming Climate Posts with “Climate Science Center” Propaganda
Even a 5th grader should smell a rat when the IPCC lie machine claims record snow droughts as evidence of CO2-driven global warming, then turns around and claims ditto for record snowfalls:
More Snow Hits the Fan this Week: Climate Change Alarmists Still Want it Both Ways
So, which is it? Global warming causes less snow or more snow? Only the IPCC Marxist lie machine tries to twist everything into proof that CO2 emissions cause endless global warming. The truth is that since all weather is local, record local cold spells and record local hot spells are not indicative of any magical rise in the nonphysical GAT numbers, but probably caused by lesser cloud cover in the summer caused by solar flares along with a general march toward a new ice age that is caused by lower net solar radiation in winter.
A team of scientists from the National Space Institute at the Technical University of Denmark (DTU Space) and the Racah Institute of Physics at the Hebrew University of Jerusalem has linked large solar eruptions to changes in Earth's cloud cover in a study based on over 25 years of satellite observations. The solar eruptions are known to shield Earth's atmosphere from cosmic rays. However the new study, published in Journal of Geophysical Research: Space Physics, shows that the global cloud cover is simultaneously reduced, supporting the idea that cosmic rays are important for cloud formation. The eruptions cause a reduction in cloud fraction of about 2 percent corresponding to roughly a billion tonnes of liquid water disappearing from the atmosphere. - <
Solar activity has a direct impact on Earth's cloud cover
Researchers show new Ice Age may begin by 2030
What Is Earth's Temperature, Now or Then?
Does a Global Temperature Exist?
What is the Earth’s Average Temperature?
Cooling the Past: Made Easy for Paul Barry
“’The temperature of the Earth’ is an ambiguous term that cannot mean anything. At any given time, it is possible to measure the temperature of some very small part of the Earth, such as, perhaps, a shot glass of water. At that same moment, other temperatures of the Earth that could be measured will show a variation from the temperature of molten rock (1,300 to 2,200°F) to polar ice (32 to -76°F). Daily variation of the same place on Earth can be 50 to 60°F. Seasonal variation can be well over 100°F in high latitudes. Conceptually, we could imagine, but not actually measure, every possible place and thing, at every possible time through all the seasons, and then average these data. To detect ‘global warming,’ we would have to modify these data to include the specific heat of everything measured, as well as the latent heat of all the things that change phase such as water, which appears as a liquid, vapor, and ice. Conceptually, yes; actually, no. Not possible.” - There's No Such Thing as the Earth's Ideal Temperature, Jerry Powlas
"The Intergovernmental Panel on Climate Change (IPCC) was set up in 1988 in order to supply scientific evidence to support this scam. It was realised from the start that the task was impossible. The earth does not have a temperature and there is no way that a scientifically acceptable average temperature can currently be derived. It is not possible to know whether the earth is warming or cooling. Then, the climate is constantly changing. No part is ever in equilibrium." - If humans aren't causing climate change then what is? - James Matkin
What is the Average Global Temperature? - The Corbett Report
What would be funny if it weren’t so tragic is that NASA only claims a total of 1.1C warming since 1880, an amount too small for animals and plants to even sense. Worse, most of that 1.1C comes from an increase in nighttime minimum temperatures. This is so small that it falls within the range of natural temperature variation, and is equivalent to zero. In 2020 they changed it from 0.8C to "a little more than 1C" (1.1C), big deal. A real physical quantity to track would be the highest temperature seen on Earth each year, which too bad for them was way back in 1913, when CO2 levels were lowest. So, in case you are amazed that I’m claiming that the Earth’s average yearly temperature is an integer with no decimal places, I need to clarify. It’s unmeasurable. See Wiki article 'Highest temperature recorded on Earth'
Worse, the IPCC quotes numbers like “0.8C”, when the raw data has way less accuracy than that, smelling of rank fraud. Until the 1960s thermometers were only accurate to two degrees F, and even today make that 1.4F except for lab thermometers. To give a figure with decimal places is like saying that the average IQ in Timbuktu has increased by 0.2 per decade, when IQs are measured as integers only. Sure, if the IQs increased by 2 per century, in hindsight one might say that’s 0.2 per decade, although on a decade by decade basis that kind of precision is useless, because it’s no longer a measurement but a prediction, but the IPCC scientists announce fractions of a degree of global warming every year, making the figures into projections not actual historical measurements. without mentioning that because of the IPCC’s political agenda they''ll turn black white and white black to get their hands on the green. Who do they think they’re zooming? Everybody knows that GIGO (garbage in, garbage out). Their big mathematical hoax is to fail to tell you that averaging a bunch of inaccurate measurements increases the precision, not the accuracy. Even beginning statistics students are taught of the fallacy of trying to take an average of an average.
"There is a common question that crops up in analytics, which is can you average your averages. The short answer is no, but a longer explanation is probably needed.
Whether you have grouped your data by month, or region, or some other facet – each average you see is based on a different number of data points. You might have an average of 10 based
on 10,000 individual data items and an average of 2 based on a single data point. If you attempt to create an “average of averages”, the single data point will disproportionately affect the outcome.
The average of 10,000 data items basically gets valued at the same rate as the average of the single data point. The “average of averages” would be 6, but the correct average of all values would be 10." -
Can you average averages in your analytics?
"What totally cracks me up is how well-educated researchers totally disregard the precision of their data in order to show change in their data. When the Fahrenheit and Celsius thermometers were first introduced in the 1700s the precision of the instruments was on the order of +- 20 degrees F. They were essentially long test tubes filled with mercury with a reservoir at the bottom and the top open to the air. They were extremely rare and other than the Cook expedition and later the Lewis and Clark expedition on the 1800’s they rarely traveled much farther than the laboratory. By 1900 the instruments were improved to where they were accurate to +- 5 degrees F, when they started to be used in weather stations scattered around the world and on ships, but they were still rare. By WWII precision had improved to +- 2 degrees F, a standard that lasted clear up to the late 1970s in weather stations with many still in operation today. It was not until the 1980s that weather station thermometers started reading temperatures in the range of a tenth of a degree with the precision of +-0.5 degrees, pretty much the norm today. Going any more accurate involves to this data laboratory thermometer and constant calibration to get any lower. Knowing this, how can any researchers on a graph present data that is greater than the precision of the instrument? The reality is they technically cannot and what they are representing is nothing but noise in the data."
- Newport Beach, Calif. geophysicist Alexander Jack
Exposed: Corrupted Climate Stations and Solutions You Need to Know (video)
The very attempt to confuse the issue by going global and and annual stink of deception. Seen in the light of the absurd 2-decimal point accuracy, the IPCC's GAT figures might as well be flat, within measurement error, and their absurd graphs magnifying a molehill to make it look like a mountain smack of pure fraud.
If they stuck to global maximum temperature each year, that would be a physical quantity, but since it isn’t rising by a fraction of .1C each year like their GAT, and can’t be manipulated with mathematical tricks, or magnified out of proportion to hide the truth that the differences aren’t statistically significant, it would kill the whole IPCC scam. No Statistically-Significant Global Warming For 9 Years 3 Months
At least the global Marxists can't completely control AI yet. Here's a refreshing breath of truth from Claude 4, one of the most advanced AIs on Earth (May 2025): "There is no such thing as 'global temperature'... It's mathematically impossible.” -
Temperature is an intensive property, therefore any attempt to average surface temperatures is a waste.
I'm not framing them. Here's some stinkin' thinkin' quotes from a Web page by NOAA:
The concept of an average temperature for the entire globe may seem odd. After all, at this very moment, the highest and lowest temperatures on Earth are likely more than 100°F (55°C) apart. Temperatures vary from night to day and between seasonal extremes in the Northern and Southern Hemispheres. This means that some parts of Earth are quite cold while other parts are downright hot.- Climate Change Proven in Global TemperaturesTo speak of the 'average' temperature, then, may seem like nonsense. However, the concept of a global average temperature is convenient for detecting and tracking changes in Earth's energy budget - how much sunlight Earth absorbs minus how much it radiates to space as heat - over time. To calculate a global average temperature, scientists begin with temperature measurements taken at locations around the globe. Because their goal is to track changes in temperature, measurements are converted from absolute temperature readings to temperature anomalies - the difference between the observed temperature and the long-term average temperature for each location and date. Multiple independent research groups across the world perform their own analysis of the surface temperature data, and they all show a similar upward trend.
Earth’s temperature has risen by 0.14° F (0.08° C) per decade since 1880, and the rate of warming over the past 40 years is more than twice that: 0.32° F (0.18° C) per decade since 1981." Averaged across land and ocean, the 2020 surface temperature was 1.76° F (0.98° Celsius) warmer than the twentieth-century average of 57.0°F (13.9°C) and 2.14°F (1.19°C) warmer than the pre-industrial period (1880-1900). That extra heat is driving regional and seasonal temperature extremes, reducing snow cover and sea ice, intensifying heavy rainfall, and changing habitat ranges for plants and animals - expanding some and shrinking others. As the map below shows, most land areas have warmed faster than most ocean areas, and the Arctic is warming faster than most other regions.
Exposed: How world leaders were duped into investing billions over manipulated global warming data
How can we trust global warming scientists if they keep twisting the truth
US Average Temperature Trends in Context
Climate Alarmists Foiled: No US Warming Since 2005
Measured temperatures have huge uncertainties from 1850 onward to 1950.
Is the government tinkering with global warming data? – Judith Curry
96% of U.S. Climate Data Is Corrupted–New Study
New Study Shows NOAA Overestimate US Warming By 50%
NOAA scientist John Bates blows whistle
Temperature Adjustments in Alabama
List of Historical Temperature Extremes by U.S. State Shows No Sign of Global Warming
The Problem With Using Old Weather Reports to Track Climate Change
USHCN final v. raw temperature differences
Study: No change in global temperatures for 100 years
Day/Night temperature spread fails to confirm IPCC prediction
The fiddling with temperature data is the biggest science scandal ever
Climate Change is a Hoax - Kary Mullis (video)
Global mean temperature uncertainty
GLOBAL WARMING REPORT: 1979-2020
Climate Past Far From Settled: 7 Major Temperature Reconstructions Find No Agreement
NO GLOBAL WARMING : Global Temperature Now 0.01 Degrees Below Average
CLIMATE : New Discoveries That Change ‘Settled Science’ Based Climate and Energy Perspectives
IPCC AR6 SPM Credibility Destroyed by “Disappearing” Medieval Warming Period.
BBC Uses Corrupted Airport Data to Circulate Scares About “Extreme Heat” and Climate Change
As Nobel Prize-winning physicist Ivar Giaever put it:
"The claim (how can you measure the average temperature of the whole earth for a whole year?) is that the temperature has changed from ~288.0 to ~288.8 degrees Kelvin in about 150 years, which (if true) means to me is that the temperature has been amazingly stable, and both human health and happiness have definitely improved in this 'warming' period.'" - Nobel Physicist Calls Earth's Temperature "Amazingly Stable"
“In the case of global warming, a number of bodies are telling us they have all the evidence, but refuse to tell us what it is. The data have been processed, but how? Time series have been altered, but why? Some phenomena have been left out of the equation, but on what grounds? We do not know, and we are simply required to keep quiet and do what we are told. No second opinion is permitted... The very definition of a global temperature for the Earth poses some serious problems. Determining an average temperature for a system as complex as the Earth has no physical meaning. Unfortunately, this question, fundamental though it is, has never been tackled by organizations involved in meteorology. For them, the answer is simple: you take all the sensors and calculate the average! The competent organizations use an arithmetic mean, adding up all the temperature readings available and dividing the total by the number of sensors. But this poses some serious problems. Now let us imagine that one sensor covers 1 km2, while the other covers 5 km2. The sensors give readings of 10ºC and 12ºC. How are we going to calculate the average temperature? Nobody knows!” ..."We are not in a position to question the composition of the IPCC, or its legitimacy and policy decisions, and we shall not do so. However, as mathematicians, we have every right to respond to the following question: if the IPCC‘s work were to be submitted for publication in a reputable scientific journal, would it be accepted? This decision is the task of a referee, in a procedure that is common practice in the sciences. The answer is very simple: no sensible, high-quality journal would publish the IPCC‘s work. The IPCC‘s conclusions go against observed facts; the figures used are deliberately chosen to support its conclusions (with no regard for the most basic scientific honesty), and the natural variability of phenomena is passed over without comment.
"The IPCC‘s report fails to respect the fundamental rules of scientific research and could not be published in any review with a reading panel."
- The battle against global warming: an absurd, costly and pointless crusade. White Paper drawn up by the Société de Calcul Mathématique SA (Mathematical Modelling Company, Corp.) http://www.scmsa.eu/archives/SCM_RC_2015_08_24_EN.pdf
"As the public increasingly is aware, these facts give harsh perspective to absolute proclamations the Earth has warmed even the claimed 0.7 degrees Celsius in 100 years. What’s the margin of error over a century with such seemingly haphazard, spotty and questionable measurements?" - "THE REAL GLOBAL WARMING DISASTER IS FINANCIAL. Trillions needed annually for Paris Accord and unreliable wind and solar.' Renewables make world hunger worse. This is the most costly and useless scientific blunder in history..
The politician-run U.N. IPCC has long been hijacking NOAA and NASA to produce the political results they demand rather than what science would demand.
NASA's "Smoking Gun" of Climate Fraud
Extending the history of NASA global temperature fraud - Tony Heller
A Considered Critique of Berkeley Temperature Series
Climate data from many countries ‘completely flawed’ (video)
New Surface Stations Report Released – It’s ‘worse than we thought’
Temperature Trend Profiles & the Seasonal Cycle
The Greatest Scientific Fraud of All Time - Part 27 (Tony Heller)
HadCRUT5 Adjusts Temperatures Upwards Again
"NASA prominently features this graph of 'global temperature' showing very close agreement between different data sets by different government agencies since 1880. I am going to show you the evidence now why the only way this could have happened is via collusion between the agencies. There is not enough data available to generate a coherent global long-term temperature record, much less have close agreement by independent agencies." - Overwhelming Evidence of Collusion, Tony Heller
Climate change is no catastrophe
Sadly, in the field of climate research and climate policy, good data, when not ignored entirely, is increasingly twisted to fit the narrative claiming that humans are causing a climate crisis.
Climate action partisans, in pursuit of political power and ever-increasing resources, force data to fit their delusion that humans must forego modern, industrial civilization to save humanity and the earth from climate doom.
This problem is more than evident in a recent report from the National Aeronautics and Space Administration (NASA) and the National Oceanic and Atmospheric Administration (NOAA) on global temperature trends.
Between them, the two agencies operate the most accurate, comprehensive system of temperature measuring instruments in the world.
But rather than cite data from their best sources when NASA and NOAA reported global temperatures on January 15, they chose to use severely compromised data from temperature readings adjusted - in a process called ‘homogenization’ - they and others gathered from biased monitoring stations.”
NASA and NOAA announced that 2019 was the second warmest year since modern record-keeping began in 1880, helping to make the 2010s the 'warmest decade on record.'
These claims are based on the utterly unreliable adjusted temperature measurements recorded by surface temperature stations scattered across the globe.
These measurements, at least the raw data from them, are usually sufficiently accurate to inform local inhabitants of the temperature and weather anomalies in their area on a particular day, but as measures of actual trends telling us something important about whether humans are causing global warming, most of them are virtually worthless.
New Heartland Study Shows 96 Percent of NOAA Surface Temperature Station Data Is Corrupted
Hidden behind climate policies: Data from nonexistent temperature stations
Is the U.S. Surface Temperature Record Reliable?
Hidden behind climate policies, data from nonexistent temperature stations
"NOAA violated its own rules when it undertook a similar adjustment process for recording ocean temperatures, beginning in 2015.” -
As David Rose wrote in the Daily Mail:
[NOAA scientists] took reliable readings from [ocean] buoys but then ‘adjusted’ them upward - using readings from seawater intakes on ships … even though readings from the ships have long been known to be too hot. When you mix bad data with good, you no more produce reliable results than you do by adding muddy river water to purified bottled water to produce safe drinking water.NASA and NOAA’s new report is another instance of ‘garbage in, garbage out,’ in which their use of bad data produces flawed results, which, based on experience, will be used to push bad policies.
NASA and NOAA jointly or separately operate the U.S. Climate Reference Network, the gold standard of surface temperature data, global satellites, and weather balloons.
The temperature data recorded by these three independent, unbiased temperature-measuring networks show minimal warming over the past 40 years.
Yet the agencies ignored these datasets in their recent report - proving their dogmatic belief in a human-caused climate catastrophe.
NASA and NOAA are like toddlers trying to fit square pegs into round holes, and just as likely as toddlers to throw fits when their efforts are stymied by reality.
The Trump administration should steeply cut NASA and NOAA’s climate budgets until agency heads and career staff get the message they will not be rewarded for repeatedly telling 'sky is falling' climate scare stories, when the truth about temperature and climate trends is, in fact, far from alarming. "
H. Sterling Burnet: NASA and NOAA's Latest Climate Warming Is a Result of Purposefully Flawed Data
Those who point to satellite measurements of Earth surface temperature never 'get' how inaccurate they are. Here's a quote from a NASA Goddard Web site:
"Since satellites technically measure neither temperature nor the surface (where people live), it’s safe to say that ground thermometers are more accurate than satellite measurements.
Here’s why:
1. Satellites measure the brightness of Earth’s atmosphere and then scientists work hard to convert that information to temperatures using computer models, which are simulations that help us better understand our planet’s complexities, like a laboratory in a computer.
2. Scientists take brightness data from 16 different satellites. Imagine getting a box of puzzle pieces but with no reference picture to show you what the completed puzzle will look like. Experts deal with a similar challenge by taking information from all of those satellites that were launched in different decades since 1978 and figuring out how the pieces best fit together.
3. Satellites measure the brightness of Earth’s atmosphere at different altitudes. For example, the layer of air measured closest to where people live is at the altitude where birds and airplanes fly. Scientists take and blend various measurements up to a height of nearly 23,000 feet (about 7,000 meters)."
EPA “Disappears” the 1930s Drought and Heat Wave Climate Data
Erasing The Dust Bowl - Tony Heller (video)
“The estimated average ±0.2 C station error has been incorrectly assessed as random, and the systematic error from uncontrolled variables has been invariably neglected. The systematic errors in measurements from three ideally sited and maintained temperature sensors are calculated herein. Combined with the ±0.2 C average station error, a representative lower-limit uncertainty of ±0.46 C was found for any global annual surface air temperature anomaly. This ±0.46 C reveals that the global surface air temperature anomaly trend from 1880 through 2000 is statistically indistinguishable from 0 C, and represents a lower limit of calibration uncertainty for climate models and for any prospective physically justifiable proxy reconstruction of paleo-temperature. The rate and magnitude of 20th century warming are thus unknowable, and suggestions of an unprecedented trend in 20th century global air temperature are unsustainable.” - Surface temperature uncertainty, quantified
One thing they usually don’t tell you is that their GAT numbers aren’t even based on actual temperature measurements, but add-in “radiative forcing”, their totally fictitious global warming caused by CO2 “back radiation”, which actually has no effect on temperatures. IPCC Science In Trouble: A Significant Drop In Global Temperature
Using An Outdated Reference Period, Germany’s DWD Weather Service Turns Cooling Into Warming
“In a high-quality glass environmental thermometer manufactured in 1960, the accuracy would be +/- 1.4F. (2% of range). The resolution of an astute and dedicated observer would be around +/-1F. Therefore the total error margin of all observed weather station temperatures would be a minimum of +/-2.5F, or +/-1.30c.” - The Metrology of Thermometers
No surprise, on Jan. 1, 2021 the IPCC World Meteorological Org. (WMO) decided to reset the baseline to make it seem like there's been another 0.5C of global warming. If you cite a larger baseline, that makes you a right-wing conspiracy nut, according to them.
Speaking of baselines. A group of French mathematicians and mathematical computer modelers explains why the use of anomalies instead of actual/absolute temperatures is purposefully misleading:
“ A temperature anomaly is the difference between the average temperature for the year in question and a long-term average, which serves as the baseline. However, these data are not very clear for the reader because these annual anomalies are calculated in relation to a ‘sliding’ baseline which changes every year. For example, the anomaly given for 2005 is in relation to the average between 1880 and 2004; the anomaly for 2006 is in relation to the average between 1880 and 2005, and so on. Worse still, data are sometimes referenced in relation to the period 1961-1990” [or many other random periods].
Although using a baseline to establish long-term comparisons might initially seem to be a good idea, it loses all meaning if the baseline itself is variable. It is fascinating to see that, on such a heavily debated subject, nowhere on the American Government site is there any mention of a simple, global figure: for year N, the average temperature is so much. This in itself is enough to set off alarm bells for any mildly curious scientist. Thinking in terms of anomalies makes no sense if the reference period varies from one organization to another (and even within an organization, as in the case here of the NOAA). There is absolutely no scientific justification for presenting data in terms of anomalies. It is tendentious and encourages conclusions concerning global warming. One has every right to expect to be given a simple, global figure, which would simply be the average of values recorded locally.- The battle against global warming: an absurd, costly and pointless crusade. White Paper drawn up by the Société de Calcul Mathématique SAOne notorious beehive of lies is the allegedly high resolution ERA5 dataset from the Copernicus Climate Change Service, which combines actual weather observation data with fake data from computer climate models, always twisted to bolster the CO2 global warming hoax; no surprise, the models are based on grid cells of 25K-28K sq. km, or about 0.25 deg. longitude x 0.25 deg. latitude, which makes it totally worthless except for lying IPCC agitprop to stir up fear and alarm that causes suckers to bow to their demands for trillions to save them.
To foist their insidious plan for world govt. which demands that every nation surrender their lifestyle along with their sovereignty to them so that they can finally go full Marxist with a world police force that keeps everybody down, the hoaxers rush into Lalaland with extrapolations out to the year 2100, demanding trillions now with no money-back guarantee. At the same time they love to alarm the public with claims that each year is the “warmest ever” without mentioning that the yearly increases are in the hundredths of one degree, i.e., fake because they are less than the uncertainty in the measurements, How disgusting to try to stretch the truth for money and power.
Environmentalists Want To Take Your Food, Your Home, And Your Children
To go along with this the IPCC has a trillion-dollar climate agitprop machine generating fake science reports about the terrible damage already being done by the measly 1.1C-1.2C warming since 1880, throwing everything they do into question. Every day the local temperature swings by tens of degrees, and all life is well adapted to take it in stride. The only real climate change we have is called the four seasons. Ever since its creation, the U.N. IPCC has systematically manufactured a fake past for the Earth to make its "global average temperature" (GAT) track the atmospheric CO2 concentration. This is not science. Real science seeks the truth and follow it where it leads. What the IPCC does is manufacture an official Bible, twisting the truth to the official narrative as needed. One glance at their too-neat graphs of GAT vs. time shows they forgot to include natural variations, a dead giveaway.
“The U.S. government is at it again, hyping meaningless records in a parameter that does not exist in order to frighten us about something that doesn’t matter. NASA [Goddard] and the National Oceanic and Atmospheric Administration (NOAA) announced this week that according to their calculations, July 2015 was the hottest month since instrumental records began in 1880. NOAA says that the record was set by eight one-hundredths of a degree Celsius over that set in July 1998. NASA calculates that July 2015 beat what they assert was the previous warmest month (July 2011) by two one-hundredths of a degree. But government spokespeople rarely mention the inconvenient fact that these records are being set by less than the uncertainty in the statistics. NOAA claims an uncertainty of 14 one-hundredths of a degree in its temperature averages, or near twice the amount by which they say the record was set. NASA says that their data is typically accurate to one tenth of a degree, five times the amount by which their new record was set. So, the new temperature records are meaningless. Neither agency knows whether a record was set. Such misrepresentations are now commonplace in NOAA and NASA announcements. They are regularly proclaiming monthly and yearly records set by less than the uncertainties in the measurements. Scientists within the agencies know that this is dishonest. They also know that calculating so-called global average temperatures to hundredths of a degree is irrational. After all, there is very little data for the 70 percent of Earth’s surface that is ocean. There is also little data for mountainous and desert regions, not to mention the Antarctic. Much of the coverage is so sparse that NASA is forced to make the ridiculous claim that regions are adequately covered if there is a temperature-sensing station within nearly 750 miles. This is the distance between Ottawa, Canada, and Myrtle Beach, S.C. cities with very different climates. Yet, according to NASA, only one temperature sensing station is necessary for the two cities and the vast area between them to be adequately represented in their network.” - http://www.washingtontimes.com/news/2015/aug/23/tom-harris-global-warming-deceptive-temperature-re/
Starting in Dec. 1978, the U. of Ala. Huntsville has been keeping satellite data on Earth temperatures, which paint a very different picture from the IPCC's fake GAT figures. - UAH satellite temperature dataset - Wikpedia
“The post below updates the UAH record of air temperatures over land and ocean. But as an overview consider how recent rapid cooling has now completely overcome the warming from the last 3 El Ninos (1998, 2010 and 2016). The UAH record shows that the effects of the last one were gone as of April 2021, again in November, 2021 and now in January 2022. (UAH baseline is now 1991-2020).” - No Global Warming, Chilly January Land and Sea, Feb. 8, 2022The last five years were the hottest ever recorded
NASA Faked Climate Data Says Retired Top UK Govt Scientist | PSI Intl
"Temperatures in cities have been known for a long time to be much warmer than surrounding rural areas. Instead of eliminating the Urban Heat Island contaminated data, NASA and NOAA use it to contaminate surrounding rural stations as well." - Contaminating Good Data With Bad (video)
2019 Wraps Up The Hottest Decade In Recorded Human History
“If you can adjust temperatures to 2/10ths of a degree, it means it wasn’t certain to 2/10ths of a degree.” - “We’re talking about less than a tenth of degree with an uncertainty of about a quarter of a degree. Moreover, such small fluctuations - even if real - don’t change the fact that the trend for the past 20 years has been much less than models have predicted.” - Richard Lindzen - 2021 ‘hottest year’ BUST: NASA GISS, UK Met Office, RSS, UAH, all show global temps declining since 2016 – 2021 an ‘imperceptible 0.134C warmer than the the 30-year average’
Science Is A Leaky Vessel In The Age Of Climate
The World Has Been Getting Much Colder For The Last Six Years
Australia’s Broken Temperature Record (Part 1)
Averaging Last Seconds Versus Bureau Peer-Review
Huge Win Against the Jokers at the Australian Bureau of Meteorology
The stunning statistical fraud behind the global warming scare
The Greatest Scientific Fraud Of All Time — Part XXIV | PSI Intl
Telling The Whole Truth About 'Average' Global Temperature Rises | PSI Intl
Climate skeptics don’t ‘deny science’
Robert Brennan's answer to Is global warming a hoax?
John Walker's answer to What’s the best single argument for global warming that is undeniable?
"If you take individual reconstructions from all over the world (from places that have not seen urbanization), you’ll see that none of those show that the earth is now exceptionally warm. The appearance of us living in the warmest era ever only appears after combining highly selected data from all over the world (usually near cities), and after that data has been ”improved” enough towards the direction of supporting the theory. For example, according to the temperature reconstruction of the Finnish Institute of Forestry, we are barely above the temperature of the Medieval Warm Period, and nowhere near the temperatures 6000 years ago, when temperatures were consistently so high they enabled pine trees to grow as high altitudes as the dotted line in the picture. Now trees grow nowhere near those altitudes, because it is too cold for them." - Jarkko Hokkunen's answer to Do Republicans deny climate change is happening? If so, how do they respond to the fact the world over are reaching all time high temperatures?
GMST is a hoax by professional charlatans
Deceptive temperature record claims Warmest month announcements have no scientific basis
Why is 2020 predicted to be the warmest year ever?
The IPCC’s so-called climate scientists also talk about Earth’s average temperature as if it can be viewed from space like a star and its radiation measured, assuming that radiation out will equal radiation in, when that can’t be true because a lot of the incoming solar radiation ends up being converted to work to generate winds and storms.
Atmospheric circulation - Wikipedia
Too bad, one of their big lies is their claim that the Sun alone can’t keep the Earth from freezing, thus that CO2 is needed to emit “back radiation” to supply the difference with a phony baloney calculation that actually makes the Earth flat, making it seem that CO2-driven AGW doesn’t need further proof. Their CO2-driven AGW theory is a total fake physics hoax, because the atmosphere can never rewarm the surface with its own radiation any more than a blanket can rewarm your body with its own radiation but only slow the cooling. The entire atmosphere slows removal of surface solar heat to space, keeping the surface within livable limits at night, and converts heat to work to create wind and weather 24/7/365, lowering the amount of radiation reemitted to space and making the radiation balance viewpoint meaningless. All along only the Sun heats the Earth’s surface, and CO2 does nothing in the atmosphere, only being useful at the surface in feeding plant life. Actually, the atmosphere's pressure caused by gravity heats the atmosphere too, providing a constant amount of warming with height called the lapse rate. Each day solar energy is deposited on the Earth's surface then radiated, convected, and evaporated back to space, adding no net heat to the atmosphere, whose great weight and pressure alone keeps it from freezing.
How much does the Sun contribute to global warming? by TLW
NASA: Why a half-degree temperature rise is a big deal - who do you believe?
How do you calculate the average yearly temperature? by TLW
Climate prediction models are all rigged to produce false “proof” of human-caused climate change
The Big Lie About CO2, by TLW
TLW's New Real Climate Science Course
Historyscoper Home Page
© Copyright by T.L. Winslow. All Rights Reserved.